Note: I let the domain expire, so this project lives on Github only.
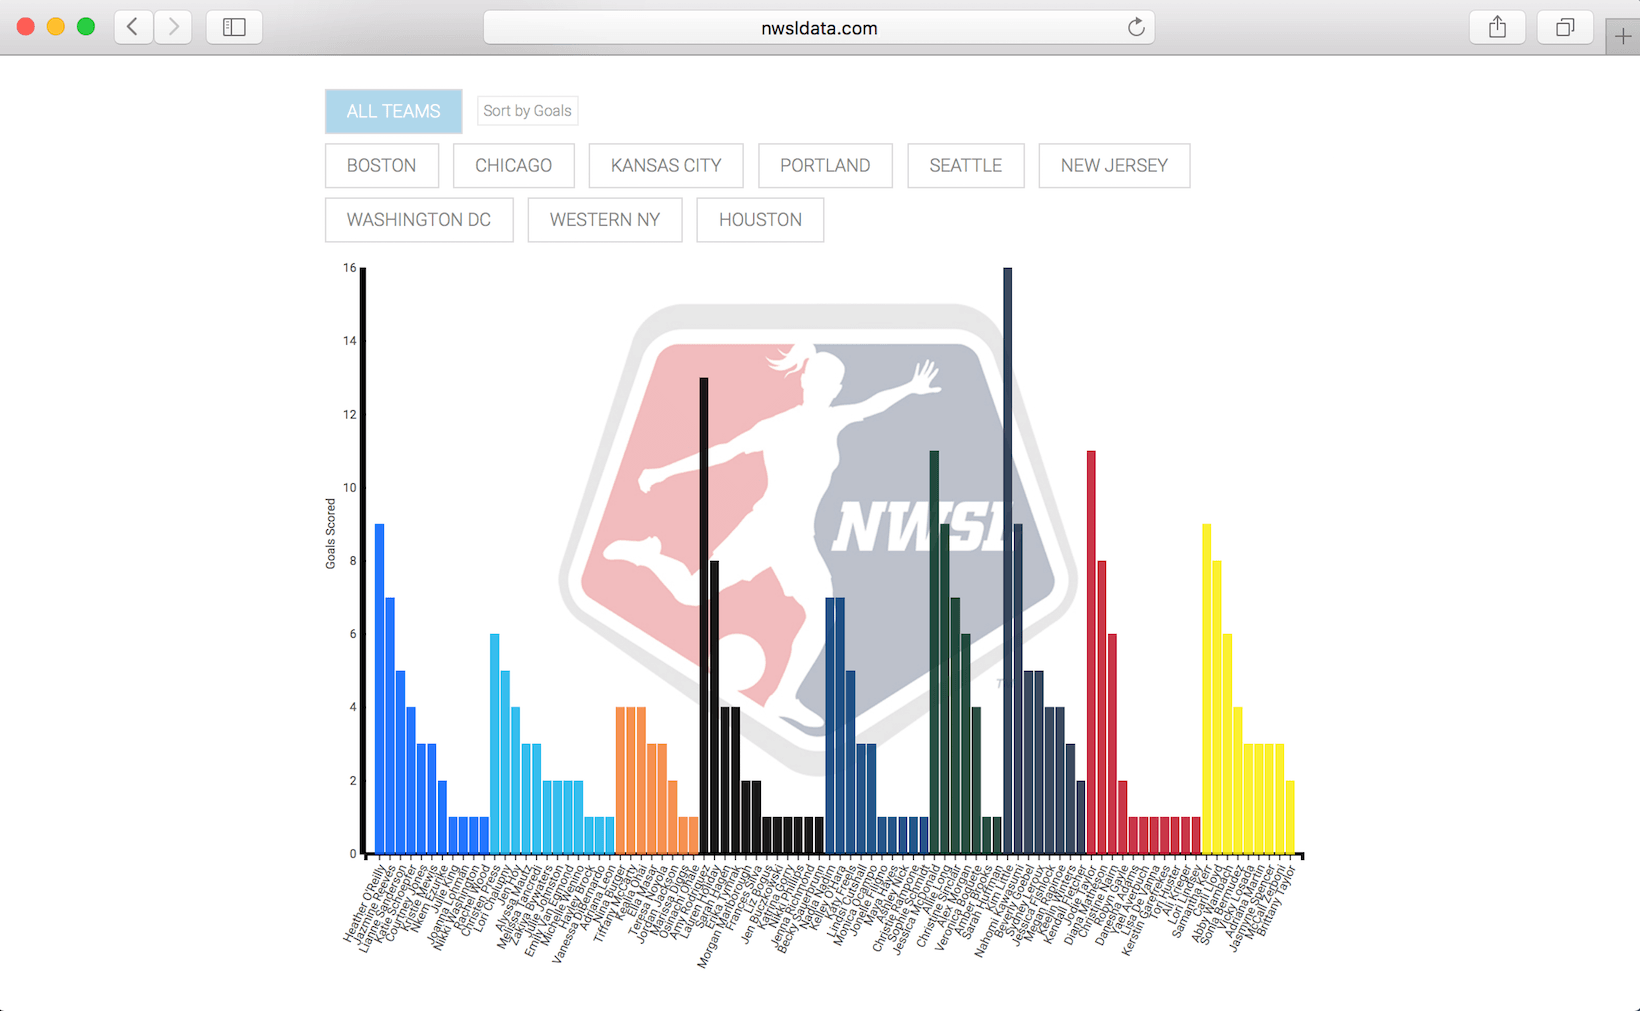
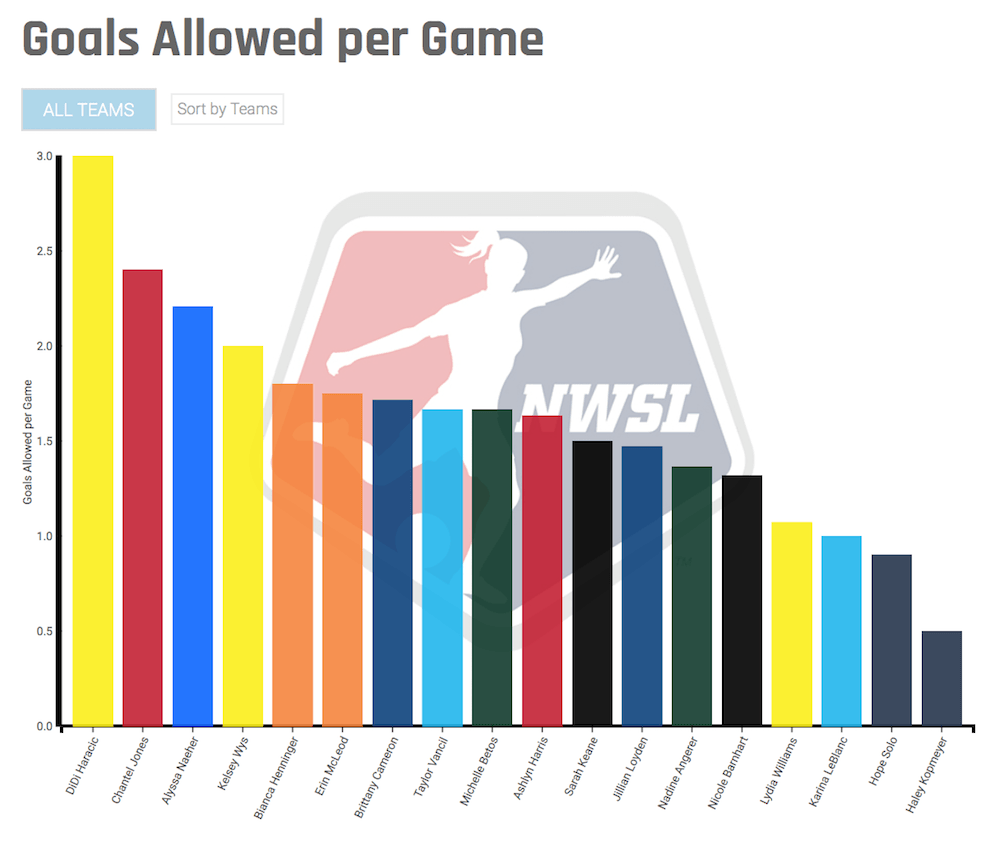
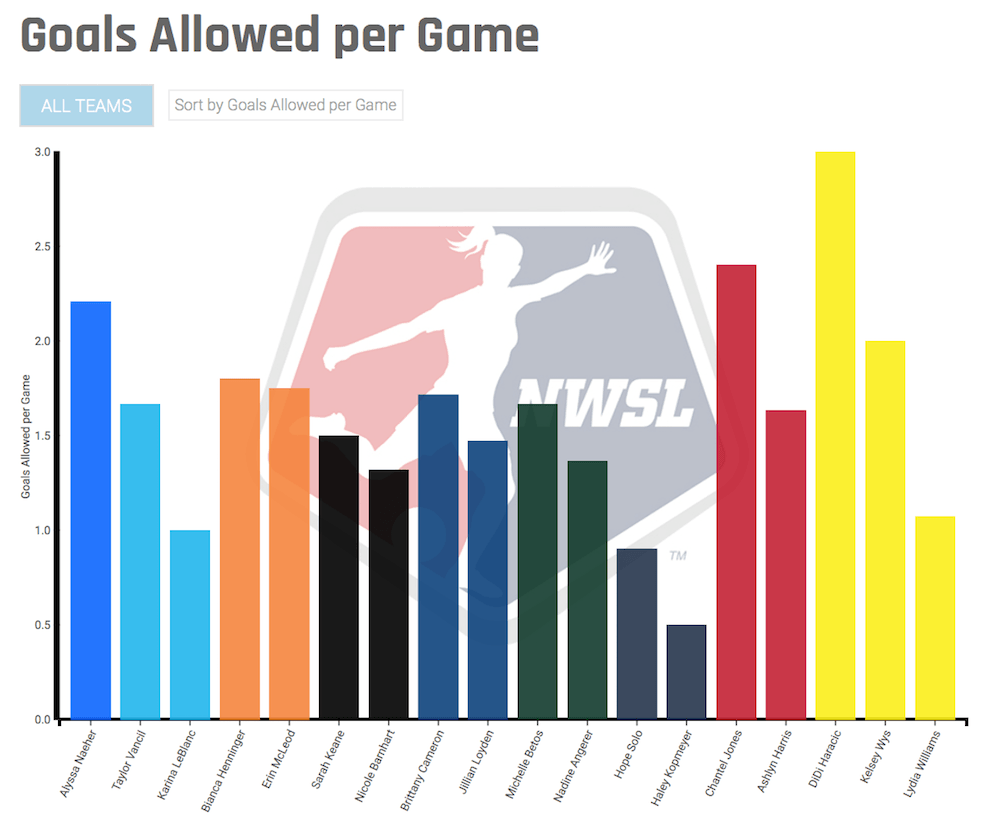
I'm a big women's soccer fan, and I saw an opportunity to improve upon the basic tabular data the National Women's Soccer League made available on its stats page by making a site displaying those statistics as interactive graphs. I used AngularJS, a powerful front-end JavaScript framework, in conjunction with D3, the premier JavaScript data-binding and visualization library.
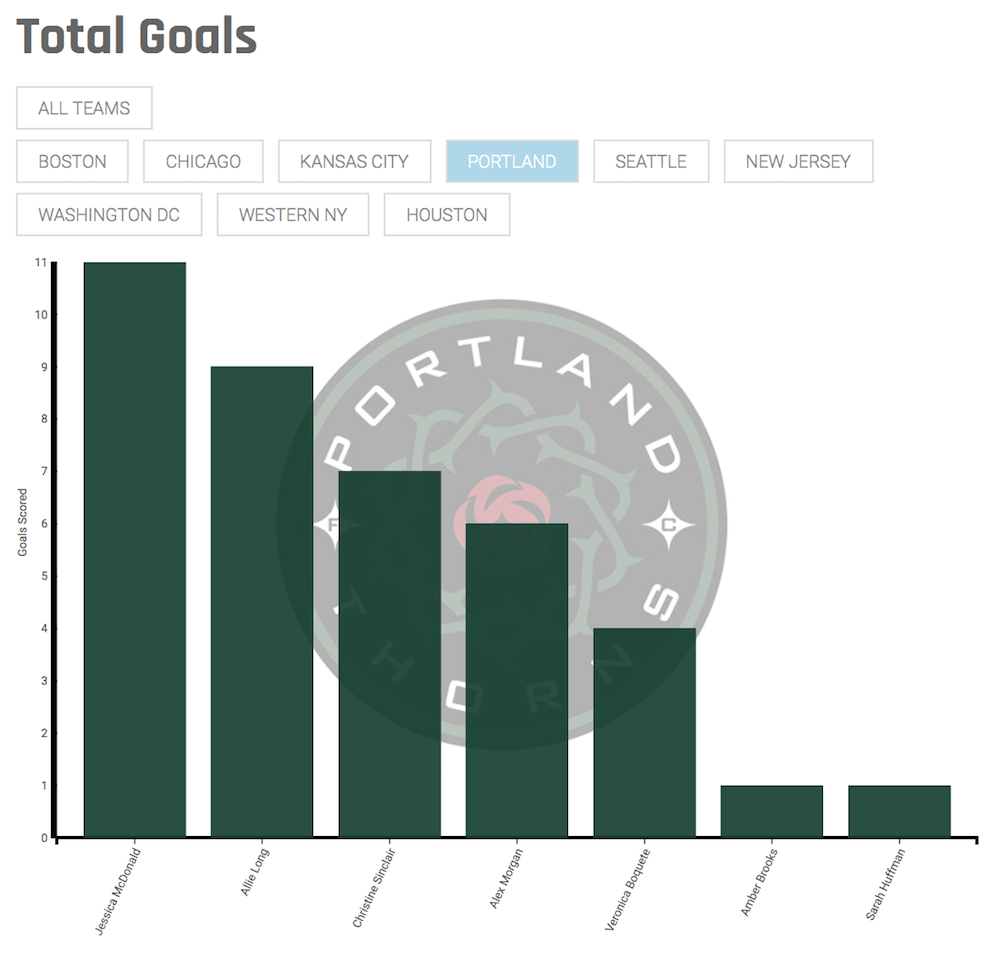
I wanted to display league-wide statistics but also give users the option to filter those stats down on a team-by-team basis. Additionally, I wanted users to be able to sort graphs in a variety of ways–by interacting with data visually, we can comprehend it better, and I wanted users to have the freedom to explore the data. Angular helps build rich applications with lots of interactivity, and D3 has robust support for updating and drilling down into data sets smoothly, without loss of context. By leveraging these technologies, I could create the interactive graphs that I needed. I managed to encapsulate all the interactive behaviors associated with a graph inside of a reusable piece of Angular code called a directive, which meant I could easily create a variety of charts with different data while preserving the same sorting and filtering controls.
I also wrote a small Express server to serve the JSON data to my Angular application and configured and deployed the entire site on a Digital Ocean server. The project taught me a lot about the whole range of development work, from concept to deployment. I hope to keep this site updated in upcoming NWSL seasons and include more graphs and data visualizations as data becomes available.